Case Studies / Daily Progress Reporting
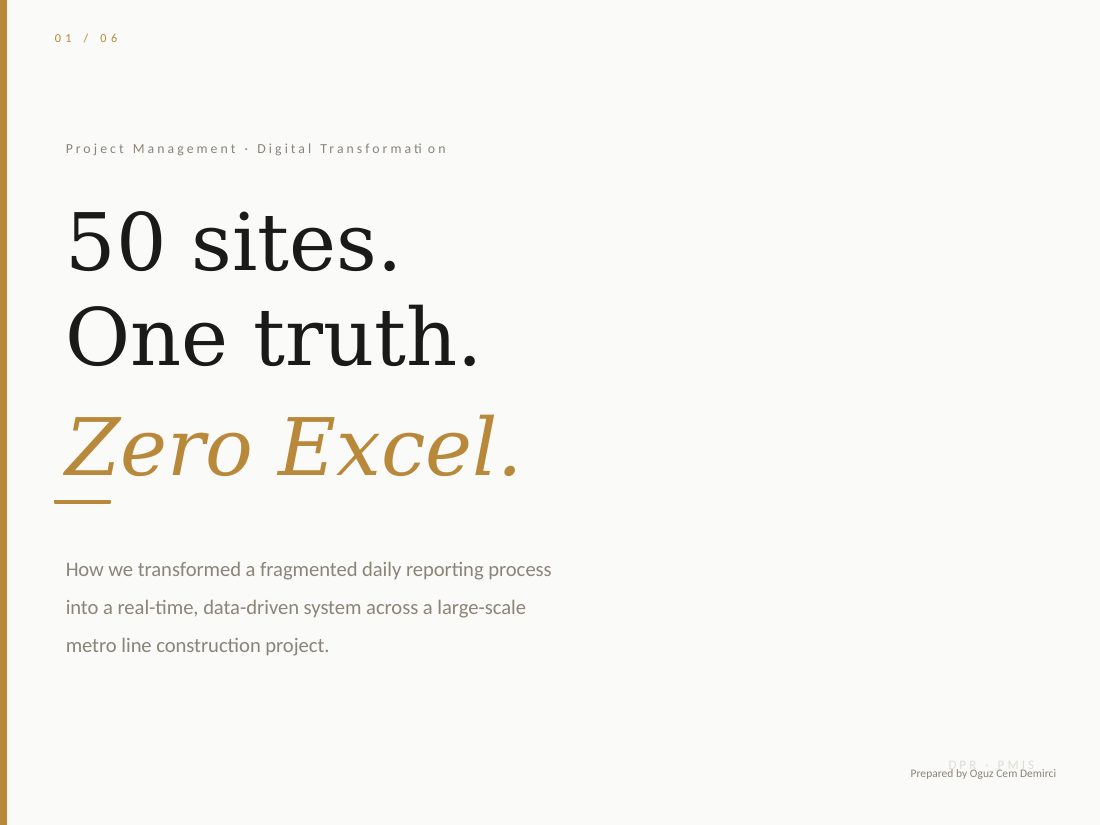
50 sites. One truth. Zero Excel.
How we transformed a fragmented daily reporting process into a real-time, data-driven system across a large-scale metro line construction project.
Background
On a large metro line, the daily progress report (DPR) is the heartbeat of project control. Every day, each site records its workforce, equipment, and progress, and that data feeds schedule updates, management decisions, and later contractor claims.
- 50+active sites reporting daily
- Multiplecontractors and site teams
- Every dayworkforce, equipment and progress data
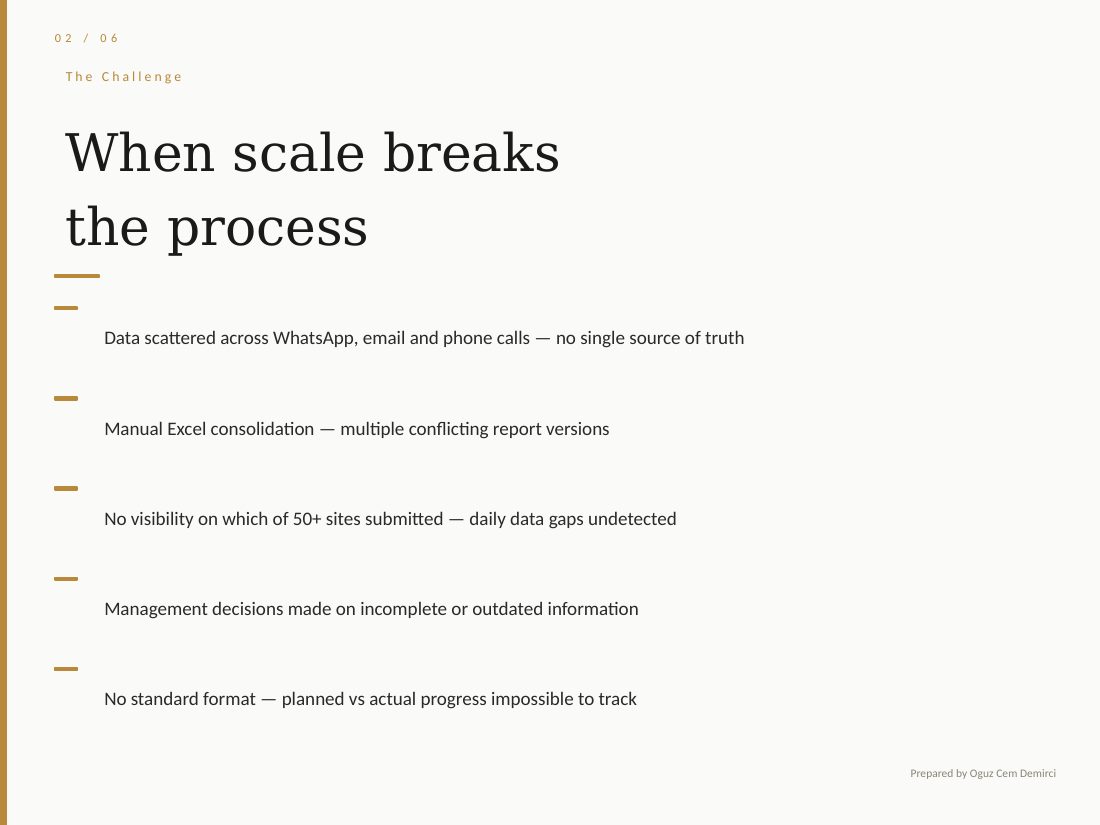
Challenge: when scale breaks the process
- Data scattered across WhatsApp, email and phone calls, with no single source of truth
- Manual Excel consolidation produced multiple, conflicting report versions
- No visibility on which of the 50+ sites had submitted, so daily data gaps went undetected
- Management decisions were made on incomplete or outdated information
- No standard format, so planned vs actual progress was impossible to track
Approach: standardize first, then digitize
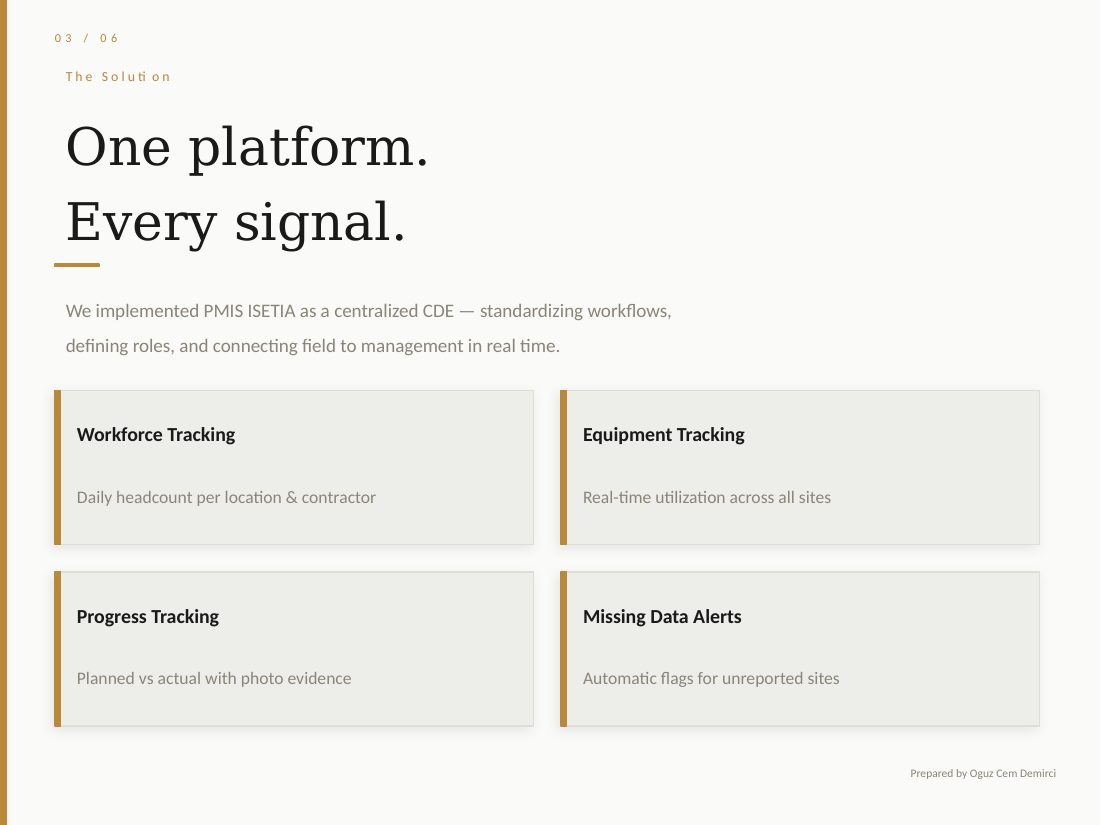
We implemented PMIS ISETIA as a centralized common data environment (CDE), but the platform was the last step, not the first. A digital system built on an unclear process only automates the chaos.
- Standardize the processOne DPR format for every site, with clearly defined fields for workforce, equipment and progress.
- Define roles & approvalsWho submits, who reviews and who approves, so data is verified at the source.
- Configure the platformWorkflows built in PMIS ISETIA as the single CDE, connecting field to management in real time.
- Train & drive adoptionTraining, feedback loops and patience, because adoption is the real deliverable.
Deliverables: one platform, every signal
Workforce tracking
Daily headcount per location and contractor
Equipment tracking
Real-time utilization across all sites
Progress tracking
Planned vs actual, with photo evidence
Missing data alerts
Automatic flags for sites that have not reported
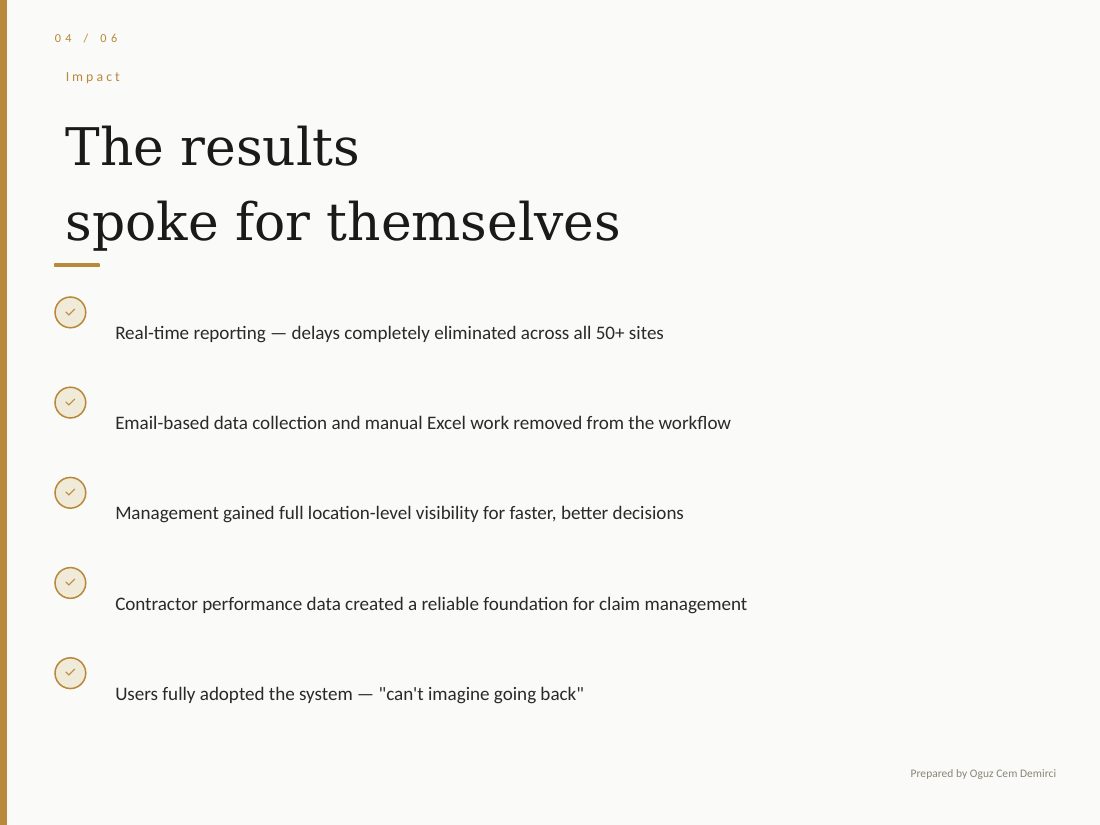
Result
- Real-time reporting: delays eliminated across all 50+ sites
- Email-based data collection and manual Excel work removed from the workflow
- Location-level visibility for management, enabling faster and better decisions
- Contractor performance data became a reliable foundation for claim management
- Full user adoption of the system
“Can’t imagine going back.”Site users after roll-out
| Before | After | |
|---|---|---|
| Data collection | WhatsApp, email, phone | One platform (CDE) |
| Consolidation | Manual Excel, conflicting versions | Automatic, single version |
| Missing reports | Undetected | Flagged automatically |
| Progress | No standard format | Planned vs actual, with photos |
| Decisions | Incomplete, outdated data | Real-time, location level |
Key learnings
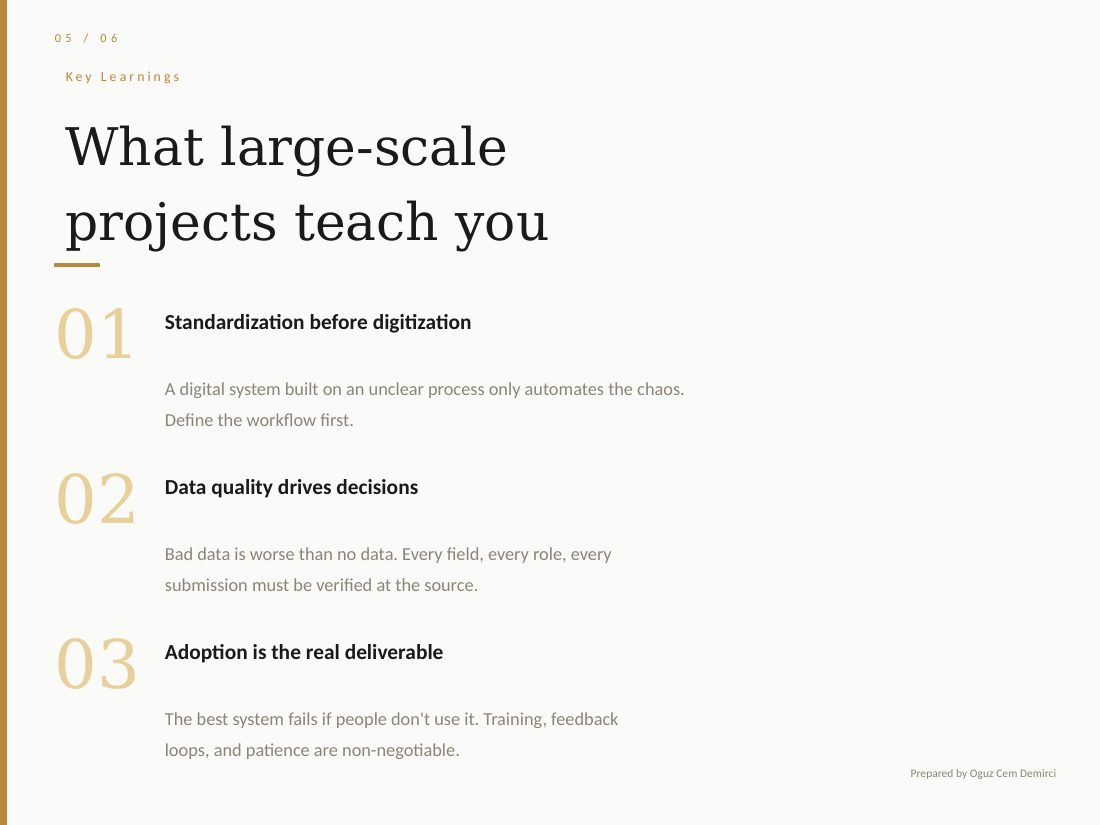
- Standardization before digitizationDefine the workflow first; a digital system on an unclear process only automates the chaos.
- Data quality drives decisionsBad data is worse than no data. Every field, role and submission is verified at the source.
- Adoption is the real deliverableThe best system fails if people do not use it. Training and feedback loops are non-negotiable.
Visual summary
The case study as a six-slide carousel. Swipe or scroll sideways.